FAQ on fires, humans and global change
Asst. Professor in the Department of Meteorology & Climate Science and member of the Wildfire Interdisciplinary Research Center, San José State University
Professor in the Department of Meteorology & Climate Science and Director of the Wildfire Interdisciplinary Research Center, San José State University

Fires, humans and global change
Fire is a chemical reaction that releases energy, including light, that humans see as a flame. Wildfires, ignited by lightning, have been a natural part of the climate system since soon after the appearance of land plants about 400 million years ago (Scott and Glasspool, 2006). Human ancestors began to use fire as a tool approximately 1 million years ago and fires have been a source of light, heat and comfort for humans ever since (Berna et al., 2012; Gowlett et al., 1981). Today, humans have a first order influence on fires in the earth system and account for approximately 90% of fire ignitions (Robinne et al., 2018). In modern times, fires occur worldwide (Giglio et al., 2006), burning approximately 4% of the global land surface each year (Doerr & Santin, 2016) and as much as 33% of the land surface each century to millenia (Robinne et al., 2018).
Humans affect fires in a multitude of ways including igniting them (both intentionally and unintentionally) (Balch et al., 2017), dramatically changing the vegetation on the land surface (and thus available fuels for fires) and actively suppressing fires (Bowman et al., 2017).
Humans are also burning fossil fuels which increase atmospheric CO2 levels. CO2 is a greenhouse gas that raises global temperatures and causes net drying over much of the world’s land surface (Sherwood & Fu), which increases vegetation flammability. On the other hand, increasing atmospheric CO2 also tends to increase shrubby vegetation at the expense of grassy vegetation on longer timescales which decreases vegetation flammability (Bond & Midgley, 2012; Knorr et al., 2016). Thus, the sign and magnitude of the influence of increasing CO2 concentrations on fire activity vary considerably from location to location, and by the level of CO2 in the atmosphere (Williams & Abatzoglou, 2016).
Considering all relevant activities, humans have caused a substantial decline in global fire activity both over the past several decades as well as in the most recent century relative to the past 2 millennia (Doerr & Santin, 2016; Andela et al., 2017; Marlon et al., 2008).
As the climate continues to warm in the future, we expect the warming and drying trends (over much of the world’s land surface) to continue which broadly contributes to conditions more favorable for fires in many locations (Robinne et al., 2018; Bowman et al., 2017; Abatzoglou et al., 2018; Pechony & Shindell 2010; Spracklen et al., 2009). Nevertheless, global fire activity is likely to continue to decrease in the future as non-climate related factors are projected to continue to overwhelm climate-related factors in their influence on fire activity (Knoor et al., 2016a; Knoor et al., 2016b).
Further information expounded upon below in the form of answers to the following frequently asked questions:
1) How natural are fires and where are they most common?
2) How do fires influence the climate?
3) What determines fire behavior once ignited?
4) How do humans influence fires?
5) How have fires been changing?
6) How much does increasing greenhouse gas concentrations influence extreme fire events?
7) How do we expect fires to change in the future?
8) What is the best way to reduce the negative impacts of fires on humans?
1) How natural are fires and where are they most common?
Fires have been a natural part of the climate system since soon after the appearance of land plants over 400 million years ago and they occur worldwide in all types of biomes (Giglio et al., 2006). Since plants and animal species have coevolved with fires over their entire history, fires provide essential services for many ecosystems like nutrient cycling, clearing decay, and the stimulation of germination (Bowman et al., 2009). Giant sequoias, for example, depend on fire to reproduce. However, fires can also have deleterious effects on the environment and people (Bowman et al., 2017). In this way, wildfires can be thought of like major rainstorms – necessary for ecosystem function but can also cause devastation in their extreme manifestations.
Natural fires are ignited from lightning but today the substantial majority of fires are ignited by humans (Robinne et al., 2018). This does not, however, mean that fire activity is increasing since humans also reduce fire activity via other means (see FAQ #3 “How do humans influence fires?”). Figure 1 shows the global land surface divided amongst different fire regimes (characterized by fires of similar frequency, intensity, season, and cause).

Figure 1 | Map of fire types categorized by whether or not fires typically burn on the land surface (surface) or in a forest canopy (crown), how frequently they occur (once every 20 years, once every 20-200 year, once every or more than 200 years for high, medium and low frequency respectively) and whether or not they are typically ignited by humans (H) or are natural (N), from Lavorel et al., 2006
Figure 2 shows the fraction of area burned annually and five other relevant fire characteristics while Figure 3 shows another categorization of the types of fires experienced. Combing this information reveals that not only are most fires human-caused but most burned area occurs in savannas (65%), followed by tropical forest (15%), boreal forest (7%), agricultural waste burning (6%), peatland (4%), and finally temperate forest (3%) (van der Werf et al., 2017). Thus, the iconic large size, long-duration “forest fires” (represented by temperate and boreal forests in Figure 3) represent a small proportion of fire activity globally. Because they represent such a small proportion, it is possible for these types of fires to be increasing in frequency and intensity while global fire activity simultaneously decreases (see FAQ #5 How have fires been changing?).

Figure 2 | Six fire regime characteristics from Andela et al., 2019.
![Figure 3 | The type of fire experienced globally separated into 5 categories [boreal forest (BOAF), temperate forest (TMPF), tropical forest deforestation (DEFO), savanna (SAVA) and agriculture (AGRI)] from Andela et al., 2019.](https://images.squarespace-cdn.com/content/v1/5c41f0a59d5abb9ac95e1cab/1591398427445-A2GNX7XYH8ROZWX39HD4/Fig.+3)
Figure 3 | The type of fire experienced globally separated into 5 categories [boreal forest (BOAF), temperate forest (TMPF), tropical forest deforestation (DEFO), savanna (SAVA) and agriculture (AGRI)] from Andela et al., 2019.
2) How do fires influence the climate?
Fires have lasting effects on the environment both locally and globally.
Fires release a great amount of aerosols which have negative health effects and have been calculated to cause 5-8% of the annual 3.3 million premature deaths from poor air quality (Lelieveld et al., 2015). Aerosols from fires also scatter incoming sunlight which has a net cooling influence on the planet (Bowman et al., 2009; Ward et al., 2012).
After a major fire, the local environment can be significantly altered and be more prone to flooding and soil erosion (Page et al., 2002). In the short run, surface albedo (the fraction of solar radiation reflected back to space from the surface) can be decreased (charred, dark landscape) and then enhanced in the long run if darker vegetation is replaced by lighter grasses (Randerson et al., 2006). The occurrence of a fire generally decreases flammability in the short term because the fuel is exhausted but an extreme fire can convert a landscape from a low flammability woody vegetation to higher flammability grassy vegetation and thus promote subsequent fire activity.
Fires also transfer carbon in vegetation to the atmosphere in the form of CO2 and CH4 which warms the planet (Table 1).

Table 1 | Greenhouse gas emissions in tones of CO2-e equivalents from Robinne et al., 2018.
The amount of carbon transferred from biomass to the atmosphere via fires is roughly 20-50% of the amount that is transferred to the atmosphere via fossil-fuel burning annually (van der Werf et al., 2010). However, carbon transferred to the atmosphere from fires is carbon that was already a part of the ocean-atmosphere-land system and was going to be cycled back to the atmosphere eventually, upon the death of the vegetation (Landry & Matthews). This is fundamentally different than burning fossil fuels which represents a transfer of carbon that was previously sequestered underground to the ocean-atmosphere-land system (Ward et al., 2012; Le Quéré, et al., 2015) (Figure 4).
To the extent that fires represent non-compensated deforestation, this carbon flux has a net warming effect and 1/5th of the radiative forcing from CO2 since the industrial revolution has been due to deforestation (Bowman et al., 2009)

Figure 4 | Visualization illustrating the difference between carbon fluxed to the atmosphere from burning biomass compared to that fluxed to the atmosphere from burning fossil fuels.
3) What determines fire behavior once ignited?
The fundamental determinants of fire behavior depend critically on the time and spatial scale considered. Scientists who study fire behavior have found it conceptually useful to represent these determinants as the edges of triangles at different spatiotemporal scales (Figure 5).
At the smallest spatiotemporal scale, the level of the flame itself, fire requires oxygen (the atmosphere is 20% oxygen and fires require at least 15% oxygen), some fuel source and a source of heat which initiates the chemical combustion reaction (red triangle in Figure 5). Once the reaction begins, it releases the heat necessary to sustain itself given that there is still sufficient oxygen and fuel present.
At the largest spatiotemporal scales, fire characteristics are mostly determined by the frequency of human and natural ignitions, the type of vegetation available to burn and the local climate (green triangle in Figure 5). Discussions of these determinants are dispersed throughout this document. In FAQ #3, we focus on the determinants fire behavior on the intermediate spatiotemporal scales of days and square kms after the fire has been ignited (orange triangle in Figure 5).
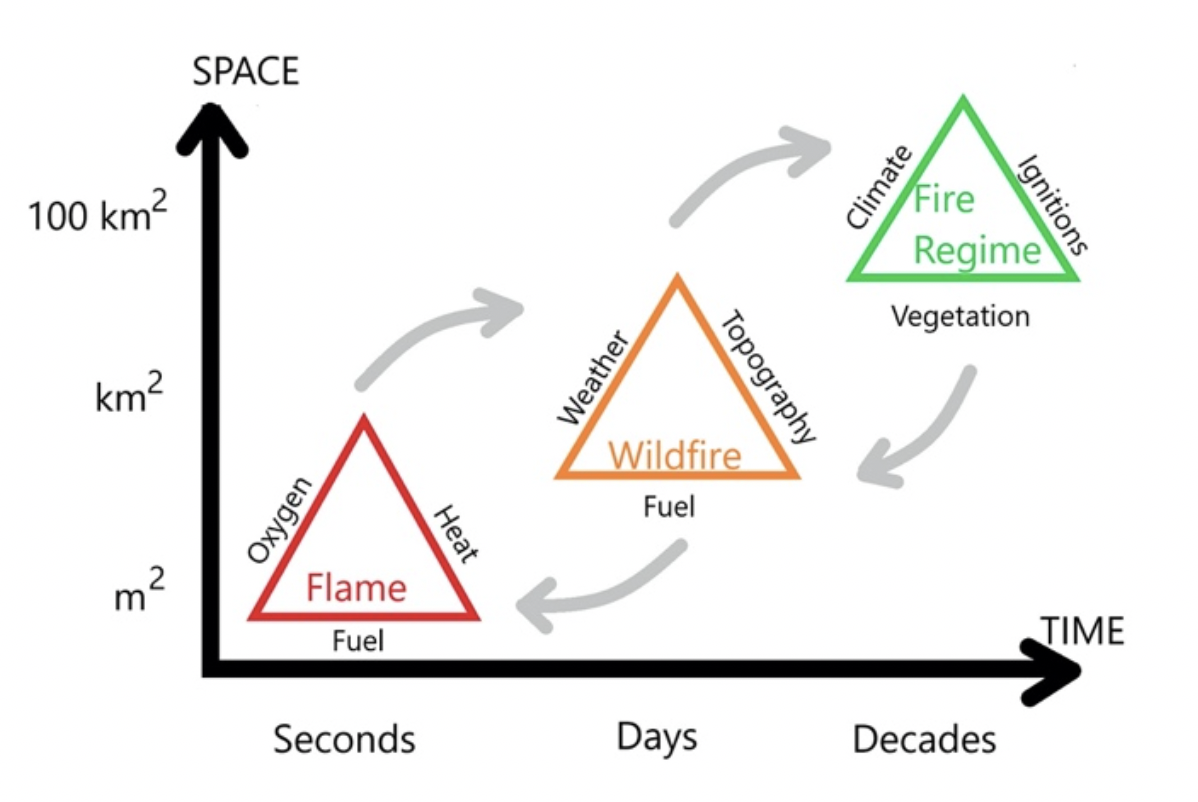
Figure 5 | Primary influences of fires represented by the edges of triangles at different time/space scales from Moritz et al., 2005
Fuel
The rate of spread of a fire (distance per unit time) and fire intensity (rate of heat release per unit time) will be heavily influenced by the characteristics of the local biomass available as fuel.
Higher fuel loadings (more mass per unit area) will be associated with more intense fires. Further, more continuous fuels in the horizontal (lacking large gaps) make for faster rates of spread. The vertical structure of fuels is also important. For example, the presence of small trees or shrubs in a forest can help transfer a surface fire to the canopy of a forest (a crown fire).
Fine fuels like dried grasses tend to promote high-rate-of-spread but low-intensity fires, while courser woody-fuels tend to promote high-intensity but low-rate-of-spread fires.
The chemical content of fuels will also heavily influence the intensity of the fires with the presence of tree oil or resin increasing fire intensity (Marlon et al., 2013; Meyn et al., 2007).
Finally, the most relevant aspect of the fuels that varies on hourly to seasonal timescales is fuel moisture. The presence of moisture inhibits fires since energy is used to evaporate water rather than to facilitate the combustion reaction and pyrolysis of the plant material, cellulose. Thus, drier fuels burn more readily and thus droughts are associated with enhanced fire activity. Fuel moisture content is also a function of whether the plant is living or dead. Topography and weather both influence fuel moisture.
Topography
Topography refers to the elevation, aspect (directional orientation), steepness of slope, and general shape of the terrain. Lower elevations tend to have more dense vegetation which would promote fire activity; south (north) facing slopes in the Northern (Southern) Hemisphere tend to be warmer during the day which promotes fire activity; steeper slopes tilt fuels into the flames of the fire which preheats these fuels and makes for faster rates of spread; and the general shape of the terrain influences the local atmospheric circulation and winds which greatly affects the predictability and rate of spread of fires (Brewer & Clements, 2019; Clements et al., 2018; Werth et al., 2011).
Weather
Local weather conditions are a huge determinant of how a fire will behave after it is ignited and extreme fire behavior occurs in situations in which a confluence of weather ingredients come together to promote intense, high rate-of-spread fires. These conditions include antecedent rainfall, temperature, relative humidity, atmospheric stability and characteristics of the wind.
Dry conditions in the days, weeks and months leading up to the fire will reduce fuel moisture and promote fire intensity and rate-of-spread. However, enhanced rainfall can enhance the amount of vegetation available to burn so a period of enhanced rainfall followed by a dry period would combine to make for extra fire-conducive conditions.
Elevated temperature primarily promotes fire activity by reducing the relative humidity, increasing evapotranspiration out of fuels and thus drying fuels. Increased surface temperatures also make the atmosphere more unstable which promotes strong updrafts. This characteristic enhances fire intensity because it encourages faster flow of air into the fire and thus greater oxygen supply. We see this effect on fires over the day/night cycle with fires being more intense during the day when the atmosphere is less stable.
Finally, wind speed and direction is perhaps the most important weather-related determinant of fire behavior. High wind speeds will act to dry out fuels, promote the supply of oxygen to the fire and orient flames more horizontally which preheats fuels downstream and increases spread rates (Werth et al., 2011). Additionally, spread rates are enhanced by high wind speeds since they can carry fire brands and embers ahead of fires, causing new spot fires and allowing fires to jump discontinuities in their fuels like rivers or highways.
Certain atmospheric conditions can combine with topography to create environments especially conducive to fires. A high-profile example would be the downslope “Foehn” winds that are associated with autumn fires in Northern California (Diablo winds) and Southern California [Santa Ana winds (Billmire et al., 2014), Figure 6]. These winds promote fire activity because they are strong, persistent over several days (caused by synoptic-scale atmospheric features) and are very warm and dry. They also prevent the typical stabilizing of the atmosphere that occurs overnight and thus allow fires to better persist overnight.

Figure 6 | Satellite image from October 22nd, 2007 of fires associated with a Santa Ana wind event over Southern, CA (NOAA).
Fires themselves also have a profound effect on the local atmospheric circulation which can feedback to affect how the fire behaves. These processes are studied in detail in the Fire Weather Research Lab at San Jose State University.
4) How do humans influence fires?
Humans influence fires in a multitude of ways both directly and indirectly. Humans directly influence fires by igniting them both intentionally (mostly to clear land for agriculture) and unintentionally as well as by actively fighting fires once they have started. Humans also affect fires indirectly by transforming the land surface and burning fossil fuels which changes climate and vegetation characteristics (Figure 7).

Figure 7 | Visualization of the pathways of human influence on fires. Humans influence fire activity via burning fossil fuels (red pathway) but this is just one and not the largest pathway of influence.
Human population has increased by 2.6 times since 1960 and human infrastructure and activities have expanded greatly into areas previously isolated from human influence. This expansion has dramatically increased the probability of human-ignited wildfires (Kloster et al., 2012). Human ignition of fires can come from cigarette butts or campfires but more common sources are sparks from malfunctioning vehicles or downed powerlines (Balch et al., 2017). Arson can also be a factor. Additionally, humans intentionally ignite fires (prescribed fires) in order to clear vegetation and it is not unusual for these fires to escape control and become wildfires.
As humans have expanded their activities, they have become the dominant source of wildfire ignition globally (Bowman et al., 2017; Harris et al., 2016). In the US, over 80% of contemporary fires are ignited by humans (Figure 8). This includes almost all the fires ignited when there is little dry-lightning activity over the months of October through March (Figure 8, right).

Figure 8 | Left, total number of fires (dot size) and the proportion ignited by humans from 1992-2012 (color of dot) from Balch et al., 2017. Right, total number of fires from both human ignition and lightning for each day of the year from Balch et al., 2017.
Humans also spend tens of billions of dollars annually on fire suppression efforts to fight fires that have started both naturally and unnaturally (Doerr & Santin, 2016), substantially cancelling the influence of increased human ignition. Fire suppression efforts include extinguishing fires, managing fuels and creating public information campaigns (Figure 9). Intentionally preventing fires, however, can create environments conducive for particularly large fires since the lack of smaller fires allows greater vegetation fuel loads to build up year after year (Marlon et al., 2012; Parks et al., 2015). In this situation, fires can occur less frequently but be much more intense and uncontrollable when they do occur.

Figure 9 | Public awareness poster advocating for the prevention of fires from Doerr & Santin, 2016
Humans also influence fire activity by changing the vegetation or fuels on the land surface. In particular, humans have radically changed the potential for fire across the globe via the conversion of forests and savannas to land fit for agriculture (Andela et al., 2017). Today, nearly 40% of the global land surface is used for agriculture (both for crops and livestock grazing). This has drastically reduced the global amount of vegetation that is susceptible to fires (Andela et al., 2017; Marlon et al., 2008). Figure 10 shows land use in the U.S. illustrating that low fire proclivity urban areas, agriculture, and livestock pastures make up a majority of the country by land area. This land use change can overwhelm other factors when it comes to it influence on total area burned even as human ignition rates rise.

Figure 10 | Land use in the U.S. aggregated by category (Bloomberg, 2018)
Additionally, the construction of highways and other infrastructure reduces fuel continuity because it creates breaks in vegetation which can serve to contain fires that are too small to jump the breaks (McWeathy et al., 2013; Faivre et al., 2014; Hawbaker et al., 2013; Hantson et al., 2015a; Hantson et al., 2015b; Knorr et al., 2014; Rabin et al., 2017).
In addition to directly igniting fires, suppressing fires, and changing the land surface (Syphard et al., 2017), humans affect global fire activity by burning fossil fuels which raises the levels of atmospheric CO2 and causes global warming.
Increasing atmospheric CO2 has two direct influences on vegetation relevant for fires. First, increased CO2 fertilizes plants (often referred to as “global greening”) which increases the raw amount of vegetation available for burning (Chen et al., 2019). Second, increased CO2 has a tendency to change the character of vegetation from grasses to more woody shrubs (a phenomenon called woody thickening) (Morgan et al., 2007; Buitenwerf et al., 2012). Woody vegetation is less flammable than grassy vegetation and thus this transition causes a net decrease in fire activity (Knorr et al., 2016).
The main climatic influences on fires are temperature, aridity/drought, antecedent precipitation, wind, and ignition through lightning (Figure 7). Since CO2 is a greenhouse gas, it raises global temperatures (Field et al., 2014), accelerates the hydrological cycle (Held & Soden, 2006), and potentially shifts weather patterns in a multitude of other ways.
Proxy evidence indicates that the largest climatic controls on fire activity are from temperature and drought. Evidence from ice cores and charcoal deposits demonstrates a general positive correlation between temperature and fire activity (Kelly et al., 2013; Power et al., 2013; Williams et al., 2015; Morton et al., 2013; Abatzoglou & Kolden 2013; Schwartz et al., 2015; Cansler & McKenzie, 2014; Riley at al., 2013). Additionally, tree rings, which record information about both temperature and fires, indicate that fire activity increases substantially during periods of drought (Williams et al., 2013; Dugan & Baker, 2015; Huffman et al., 2015; Margolis & Swetnam, 2013; Margolis, 2014; O’Connor et al, 2014; Bigio et al., 2016; Trouet et al., 2010). Increasing CO2 unambiguously increases global temperatures. It also increases precipitation in the global mean but over much of the Earth’s land surface, evaporation tends to increase more than precipitation, resulting in a net drying of vegetation. This net drying of fuels should work to increase the prevalence of fires (Jia et al., 2019) and this is particularly the case in areas where precipitation increases during the wet season (allowing for the growth of more fuels) but decreases during the dry season (allowing for those fuels to become drier) (Swetnam & Betancourt).
Global warming is also expected to alter the location and intensity of the mid-latitude storm track which would shift lighting ignitions, major wind corridors, and precipitation distributions. In general wind speed is expected to decline in a warmer climate (Karnauskas et al., 2018) which would reduce fire spread rates all else being equal.
5) How have fires been changing?
General climatic trend towards warmer land surfaces (in all locations) and drier land surfaces (in many locations) cause a tendency towards more fire proclivity (Field et al., 2014). One measure of the conduciveness for fires is the length of the fire season, which is a measure of the amount of time during the year when fuels are sufficiently dry for fire activity. By this measure, the length of fire season has increased statistically significantly over 25% of the land and decreased over 10% of the land (Figure 11).

Figure 11 | Trends in fire season length from 1979-2010 from Jolly et al., 2015
However, arid conditions are just one of a multitude of factors by which humans can influence fire activity (Figure 7). Overall, the net effect of all human influences on fires over the past two decades, (when precise satellite measurements have been available) has been one of net fire suppression (Doerr & Santin; Andela et al., 2017; Andela et al., 2019; Earl & Simmonds, 2018). Reduced fire activity can be seen in a number of metrics, including average fire size, burned area and the number of fires globally (Figure 12).
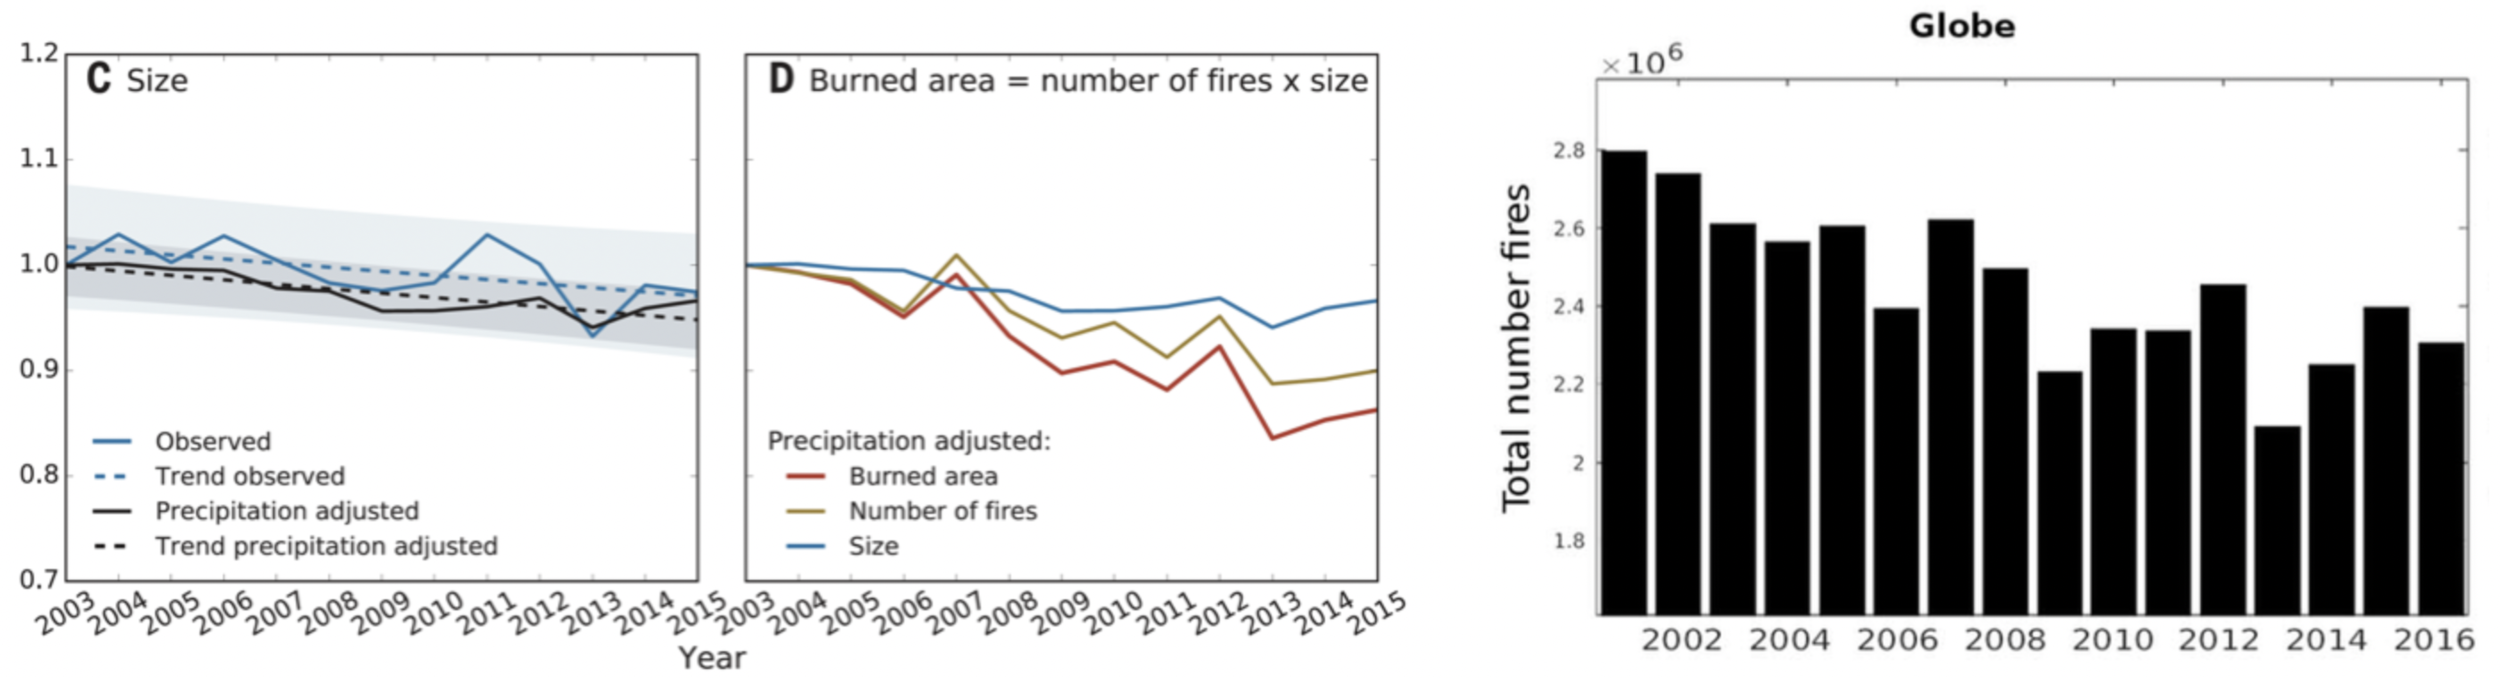
Figure 12 | Global fire activity in a several metrics since the earth 2000s. Left and middle panel, from Andela et al., 2017, right from Earl & Simmonds, 2018
Despite the reduction of fires globally, some select locations have seen an increase in fire activity over the past couple of decades (Figure 13). Furthermore, the conditions necessary for severe fires have increased in locations that have experienced particularly damaging wildfires recently like California and Australia (Goss et al., 2020; van Oldenborgh et al., 2020).

Figure 13 | Rate of change of fire activity from 1998 to 2015 from Andela et al., 2017
To follow up on the high-profile example of California, that is a region that has seen large increases in annual burned area in recent decades (Figure 14). All the pathways in Figure. 7 are active in California and the influence of each pathway relative to the others depends on the location, fuel type and season (Williams et al., 2019). In this particular instance it appears that the aridity pathway dominates other pathways in Northern California forested areas during the summer (Williams et al., 2019).
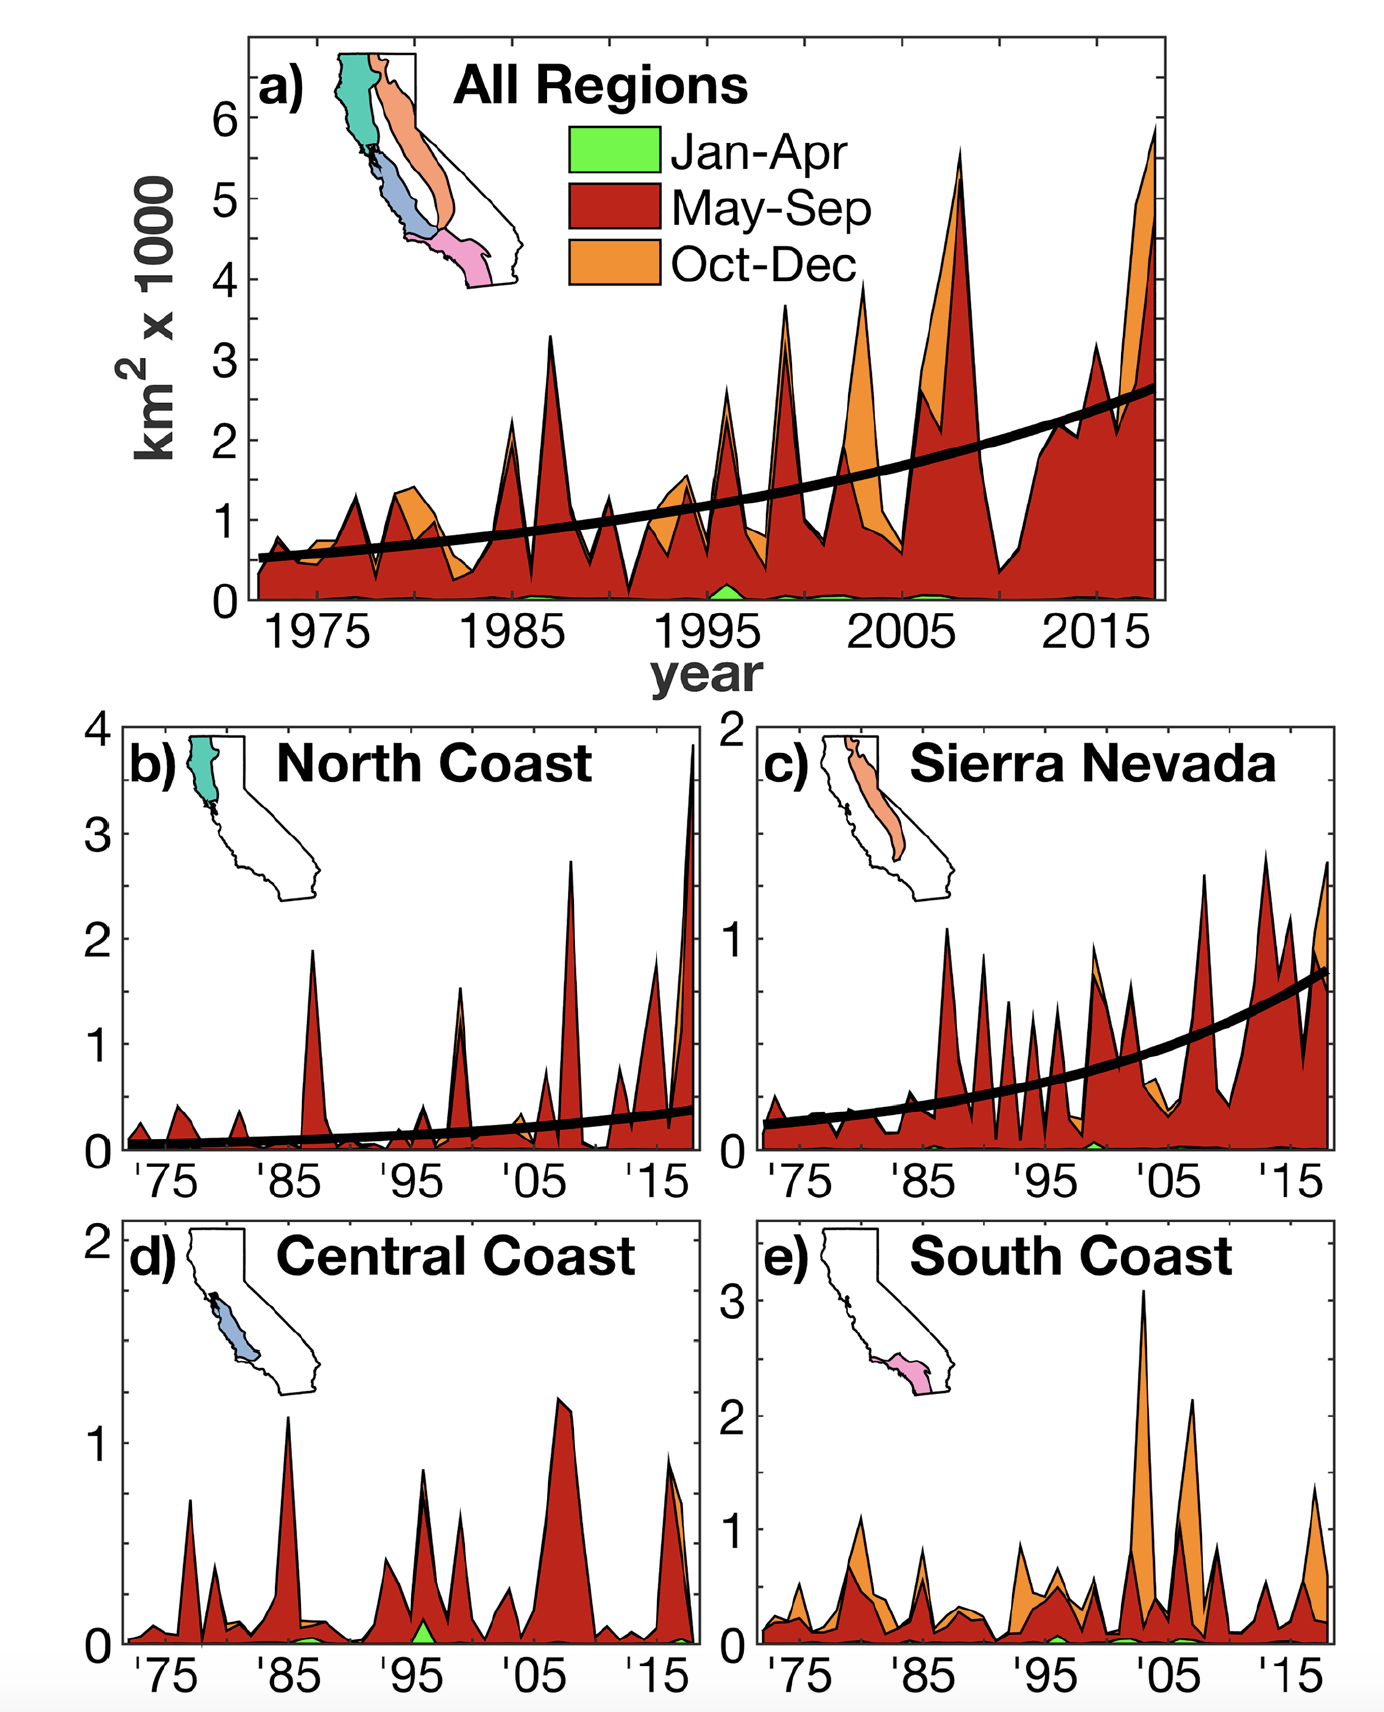
Figure 14 | Burned area in California (a) broken down by region (b-e) and season (colors) from Williams et al. 2019
Considering trends prior to the satellite record are more uncertain but these estimates also indicate a decrease in fire activity over the 20th century (Mouillot et al. 2005; Yang et al., 2015). Additionally, on centennial timescales, charcoal records indicate that deforestation in the 19th century lead to a relative peak in fire activity but that the 20th century saw the least biomass burning of any century over the past 2,000 years (Andela et al., 2017; Earl & Simmonds, 2018) (Figure 15). This trend in reduced fire activity is expected to continue for at least the next several decades (Figure 18).

Figure 15 | a, global estimate of fire activity (biomass burning) showing that deforestation in the 19th century lead to a relative peak in global fire activity but that fire activity in the 20th century was near a minimum over the past 2,000 years. b,c,d and e, other factors relevant for fire activity (from Marlon et al., 2008).
6) How much does increasing greenhouse gas concentrations influence extreme fire events?
Increasing greenhouse gas concentrations represent a slowly evolving influence on the surrounding environment in which fires occur. The primary environmental changes that are operational are an increase in temperature and an increase in aridity (Sherwood & Fu, 2014). However increasing greenhouse gas concentrations may also affect the persistence of blocking high pressure systems that dry out fuels, wind characteristics, antecedent precipitation, and lightning ignition frequency (Figure 7).
Extreme wildfire events occur, almost by definition, during times that are extremely conducive to fire activity (Bowman et al., 2017). In order for the environment to become extremely conducive to fire activity, a confluence of factors must come together. Most of the proximate factors that make for an extremely conducing fire environment will be natural in origin (Swetnam & Betancourt, 1990; Andela et al., 2014) and riding on top of a more gradual warming and drying trend due to increased greenhouse gasses.
As an example, consider a location that has had plenty of rain for a number of years and thus has built up a large fuel load. Then suppose that a string of El Niños causes a prolonged drought in that location. Further suppose that a heatwave occurs where temperatures are 7°C above normal for a month. On top of this, weather systems set up such that strong warm downslope winds persist. All these factors come together to create an environment particularly conducive to fires and an extreme wildfire event occurs. What can we say about the impact of increased greenhouse gas concentrations on this event?
We can say with certainty that the heatwave would not have been as strong without global warming: It may have been 5.5°C above normal instead of 7°C above normal (Brown, 2016) (taking into account land amplification of warming). So perhaps 20% of the magnitude of the heatwave can be thought of as directly due to increased greenhouse gasses. Furthermore, increased greenhouse gas concentrations may have increased fuel aridity. Thus increased greenhouse gas concentrations had an influence and caused conditions to be more conducive for fires than they would have been otherwise. However, presuming that the impact of increased greenhouse gasses had a negligible impact on the other ingredients mentioned above, it is not clear that the heatwave enhancement can be thought of as having a dominant impact on the fire event. This question can be interrogated on a case-by-case basis with advanced modeling techniques (van Oldenborgh et al., 2020) but there is no universal answer to the question. Indeed, thus far, the influence of increased greenhouse gasses has not been the dominant influence on fire activity globally as we have observed persistent declines in fire activity despite increasing greenhouse gas concentrations (FAQ #5).
7) How do we expect fires to change in the future?
As the earth continues to warm due to increasing greenhouse gasses from burning fossil fuels, we expect warmer and generally drier conditions and thus a trend towards weather that is more conducive for fire activity (Bowman et al., 2017; Abatzoglou et al. 2019; Pechony & Shindell, 2010; Aldersley et al., 2011; Abatzoglou & Williams, 2016; Fernandes et al., 2017; Liu et al., 2010). Wind patterns are also an important ingredient for fire behavior but wind speeds are generally expected to decrease over Northern Hemisphere land areas this century (Karnauskas et al., 2018).
Complicating matters further, fire activity is influenced by a number of factors apart from climate (FAQ #4) (Harris et al., 2016; Hantson et al., 2014; Hantson et al., 2015). Over the past century, global warming has not been the dominant influence on global fire activity as global fire activity has decreased (Figures 12, 13, and 15). Thus, we expect more fire activity under global warming than we would expect otherwise but not necessarily more fire activity than today (Figure 18).
The relative influence of warming to other factors will undoubtedly vary by location and in some locations we expect the temperature and aridity increase effect to dominate other effects and we expect fire frequency to increase (Figure 16 and 17) (85). For example, over the western United States, quite a bit of the variation in historical burned area can be explained by temperature variation. If these relationships persist into the future, area burned in the western United States could increase by over 50% by the 2050s (Spracklen et al., 2009).
Projections of global fire activity that take into account all relevant influences on fires, like human land use and population changes, suggest that we could be headed for a minimum in fire activity by mid-century and then potentially an increase over the latter half of the century (Knorr et al., 2016a; Pechony & Shindell, 2010; Knorr et al., 2016) as the climate change effects begins to dominate over other factors (Figure 18).
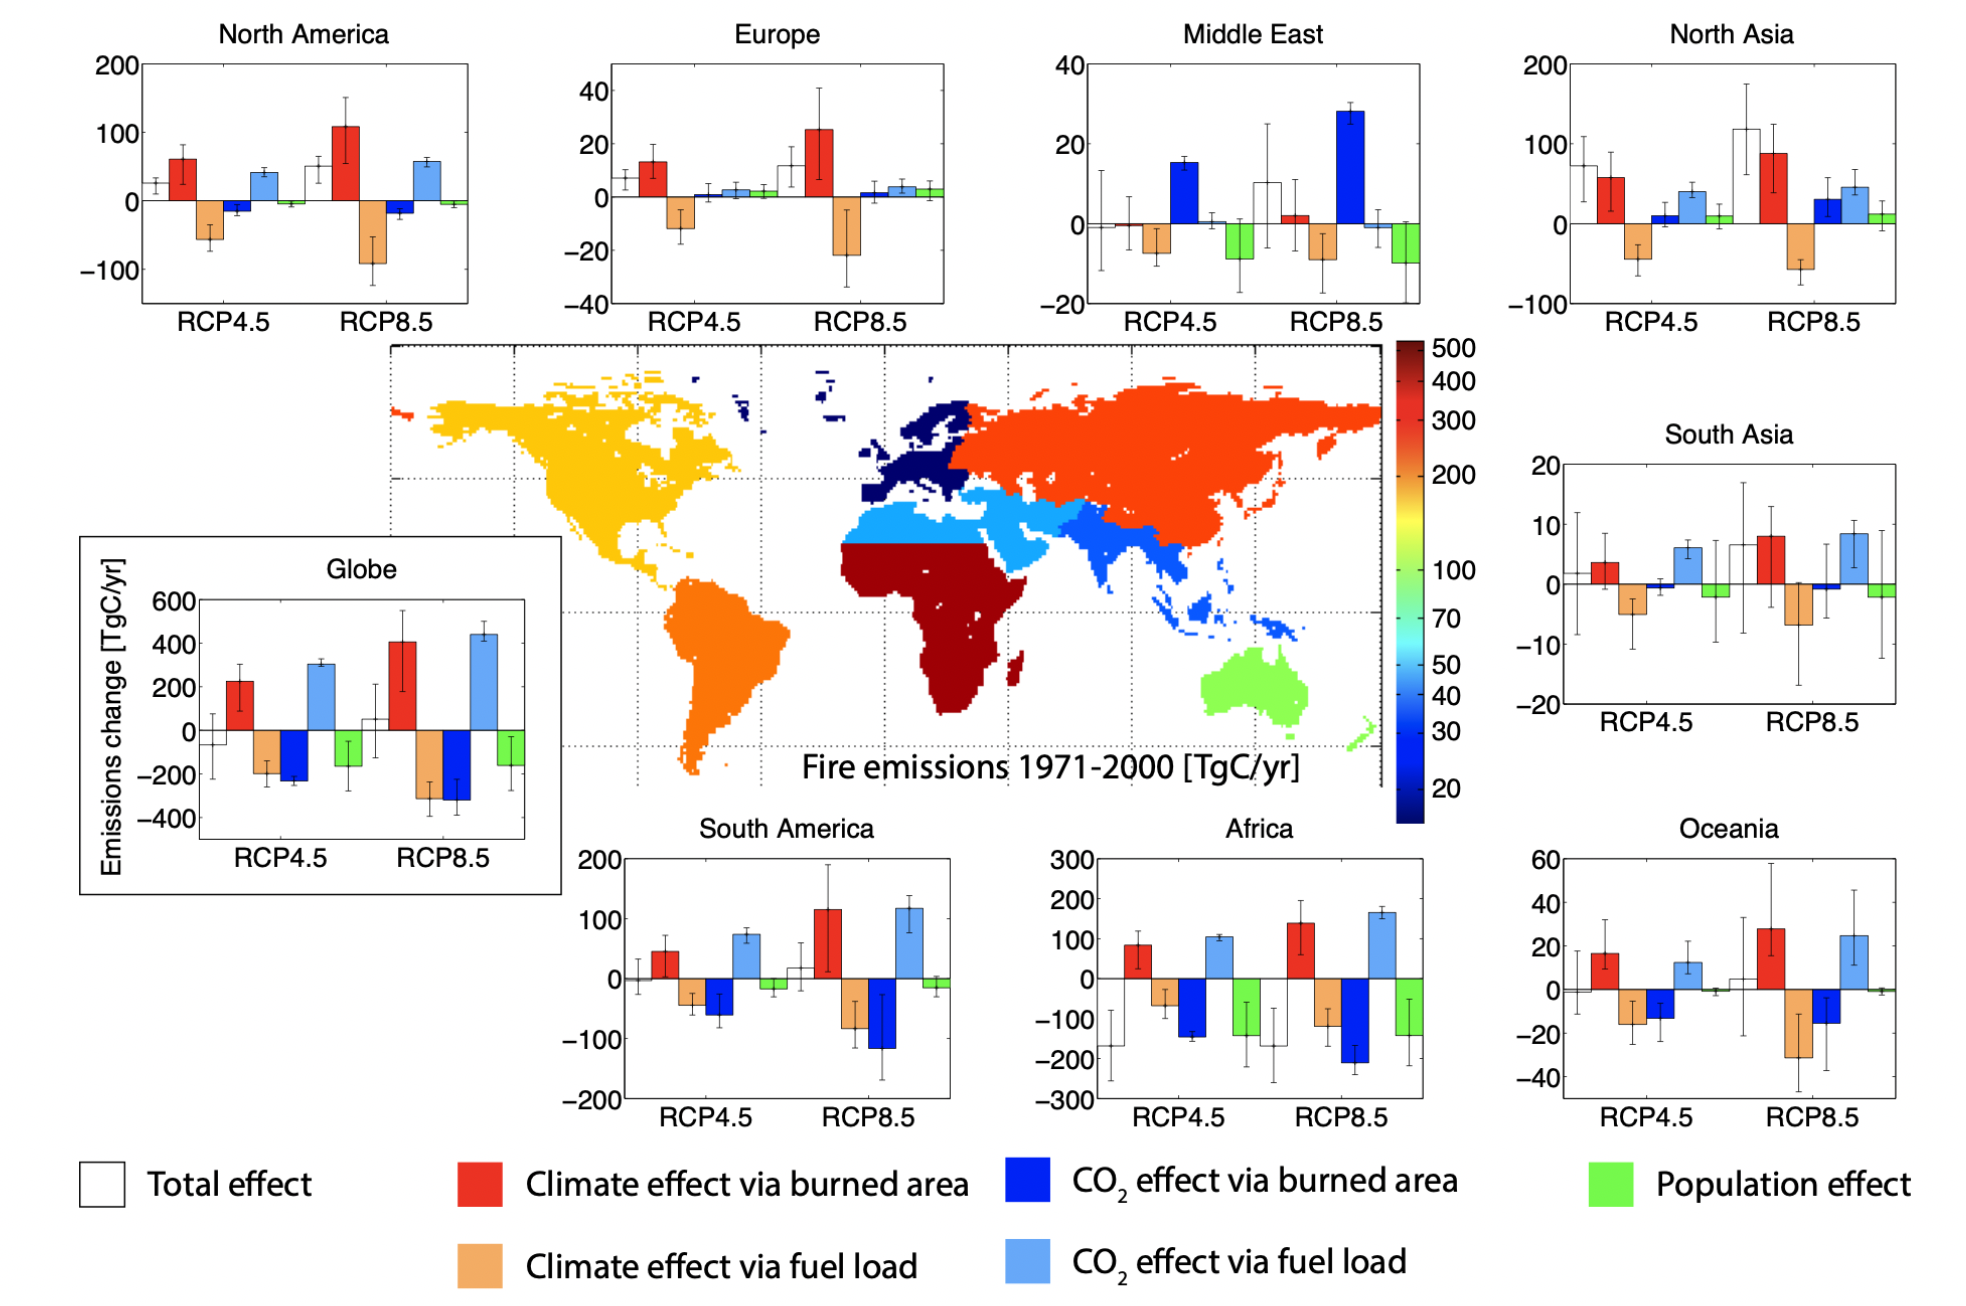
Figure 16 | Region-by-region projections of change in fire activity as measured by emissions of carbon (TgC/yr) from Knorr et al., 2016. The impact on total change is decomposed into 5 factors and is shown for a high future greenhouse gas emissions scenario (RCP8.5) and a medium future CO2 emissions scenario (RCP4.5).

Figure 17 | Estimate of the likelihood of a change in wildfire activity over the 21st century, from Knorr et al., 2016

Figure 18 | Model simulations of global fire activity (represented by carbon emissions from fires between 1900 and 2100 from a middle greenhouse gas emissions scenario. Most of the difference in future fires depend on the rate of human urbanization and other sociogeographic factors (from Knorr et al., 2016)
8) What is causing the wildfire crisis in California and the US West?
There has been a well-documented increase in wildfire activity in the California (and the US West more generally) over the past several decades culminating the the record-setting 2020 season where 4,397,801 acres (4% of the state) burned in California (Figure 19).

Figure 19 | left) area-burned in 2020 in California. Right) annual area burned in California (from Calfire).
The increase in annual area-burned over the past several decades in California and the US West represents a reversal of a previous trend of decreasing wildfire activity which reached a minimum in the 1960s and 1970s (Figure 20). In fact, it has been estimated that the typical amount of area burned in California prior to 1800 was ~4,400,000 acres (Stephens et al., 2007), more than was seen in the 2020 season.

Figure 20 | Annual area-burned in US West from Bowman et al., 2020
The multi-decadal trend of reduced wildfire activity extending from the 1800s to the 1970s is attributable largely to colonization and reduced indigenous populations (who used controlled burns for a variety of purposes) and subsequently policies of intention fire suppression (Figure 21).

Figure 21 | A cross section of a tree from California illustrating fire suppression policy starting in the early 1900s. Nine burn scares are apparent from 1783 to 1908, indicating that the tree experienced fire (which obviously did not kill the tree) about once every 14 years. Since 1908, however, no burn scares are seen, indicating the fires have been suppressed.
The past century of intentional fire suppression has allowed much more vegetation to build up on the surface of forests than would be there otherwise. This means that when fires do occur, there is more fuel for them to burn and they can become more severe, destructive, and difficult to contain (Figure 22).

Figure 22 | Comparison of fire occurring in a forest where an unnatural amount of surface vegetation has been allowed to build up due to fire suppression policies (top) and a forest that is either managed through controlled burns / mechanical thinning or has been allowed to experience natural fires (bottom).
Global Warming has also influenced fire activity in California primarily by increasing the length and intensity of the fire season. California’s climate is conducive to wildfires since it is in the path of storms in the winter (which provides sufficient precipitation for vegetation to build up) but is under a subtropical high in the summer (which inhibits precipitation and allows that vegetation to dry out). There is some evidence that the subtropical high may be expanding under global warming (Hu et al., 2018) which would put California under the subtropical high for a larger portion of the year, effectivity extending the summer dry season conducive to fires. However, the primary impact from Global Warming on California fires is that increases in temperature are directly associated with increases in the atmosphere’s ability to take moisture out of vegetation and thus dry out fuels ().
9) What is the best way to reduce the negative impacts of fires on humans?
Reducing global greenhouse gas emissions in the long term is critical to slowing and eventually halting global warming. However, because of social, technical, and geophysical inertia, the earth will almost certainly continue to warm through the remainder of the 21st century. The very most ambitious plans set forth by the international community aim to reduce emissions such that global temperatures stay below 1.5°C and 2°C above preindustrial levels by 2100 (Figure XXX). Thus, we anticipate an absolute minimum of 50% to 100% more global warming above preindustrial levels this century.
However, land management practices can overcome climatic factors in terms of their influence on fire activity (Bowman et al., 2017). So in addition to reducing greenhouse gas emissions, the only way to reduce the impact of fires on people in the near term is to reduce human exposure by building less in fire-prone areas and by improving fire management strategies like fuel reduction treatments (Moritz et al., 2014; Pretis et al., 2018) and better allocation of resources to firefighting.

Figure XXX | Various CO2 emissions scenarios over the 21st century (lines) and the associated level of global warming by 2100 (bars on right side) from Rogelj et al., 2018